279 valid observations
279 attempts recorded; 279 successful transport responses. Validity checks are distinct from HTTP success.
Published · Pilot Study · Edition 01
Independent research · Digital-asset market structure
A public order-book pilot on quoted spreads, displayed depth and indicative execution costs.
Observed 24 October 2026, 10:02:08.999–10:32:10.200 UTC. The report is in English; a Persian executive summary is also available.
An order book makes liquidity visible. It does not make execution certain.
This independent pilot examines quoted spreads, displayed depth and static, finite-size order-book sweep costs at three selected Iranian spot trading venues. The actual sample contains 279 valid venue–market observations from 279 recorded attempts, across 31 observed rounds. The planned design was 279 observations across 31 rounds; planned counts are not substituted for observed evidence.
The observations run from 24 October 2026, 10:02:08.999 UTC to 24 October 2026, 10:32:10.200 UTC. The study covers Nobitex, Tabdeal and Exir, each for USDT/IRT, BTC/USDT and BTC/IRT. It is a bounded pilot, not an exchange ranking, a representative market census or a statement about typical daily liquidity.
For conceptual background, see liquidity in fragmented markets and displayed versus executable prices. Their worked examples are hypothetical and separate from this pilot's observed sample.
Its original contribution is this recorded sample, explicit unit normalization, source-quality assessment and reproducible calculation framework. Existing work motivates treating quoted spread, depth and size-sensitive costs as distinct measures; its historical empirical findings are not transferred to these venues.1, 2, 3
279 attempts recorded; 279 successful transport responses. Validity checks are distinct from HTTP success.
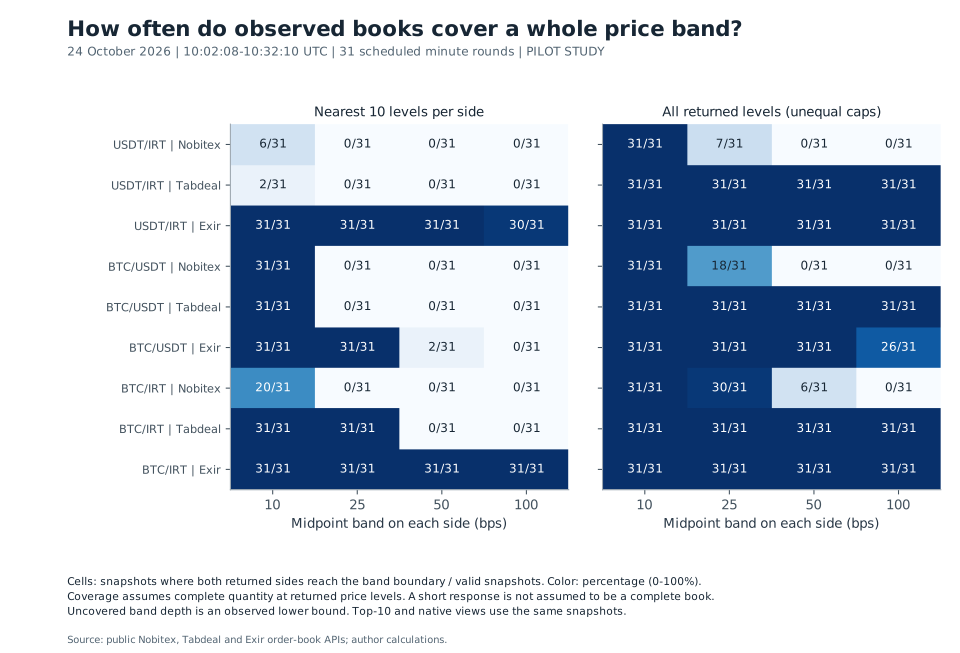
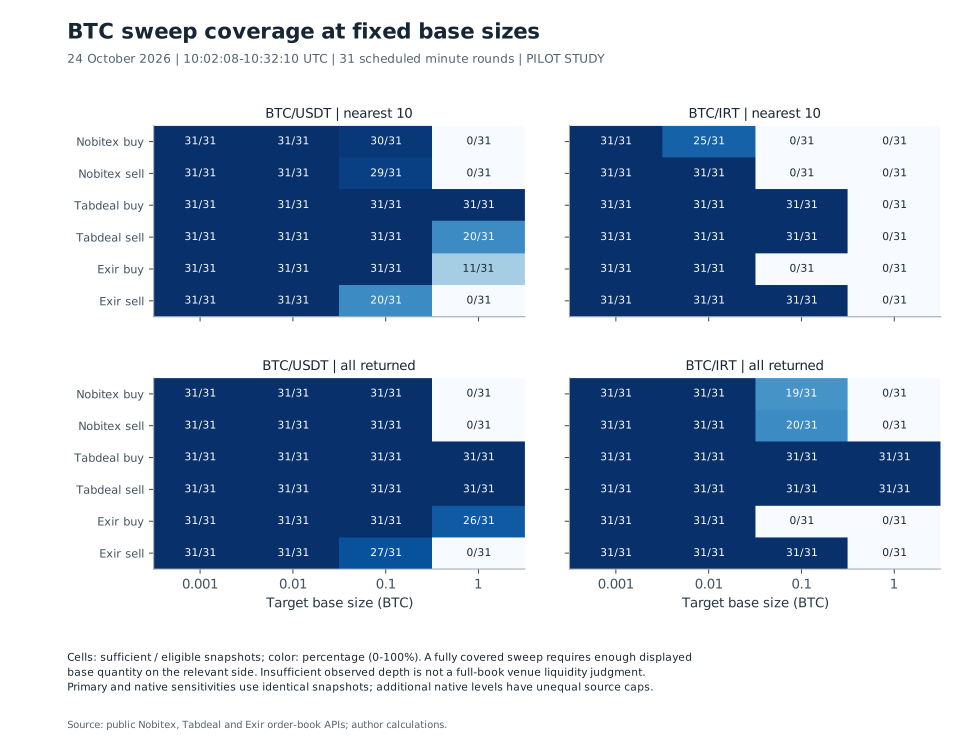
Both band boundaries reached in the primary nearest-ten-level view. In the all-returned-level sensitivity: 241/279. These are coverage counts, not a liquidity score.
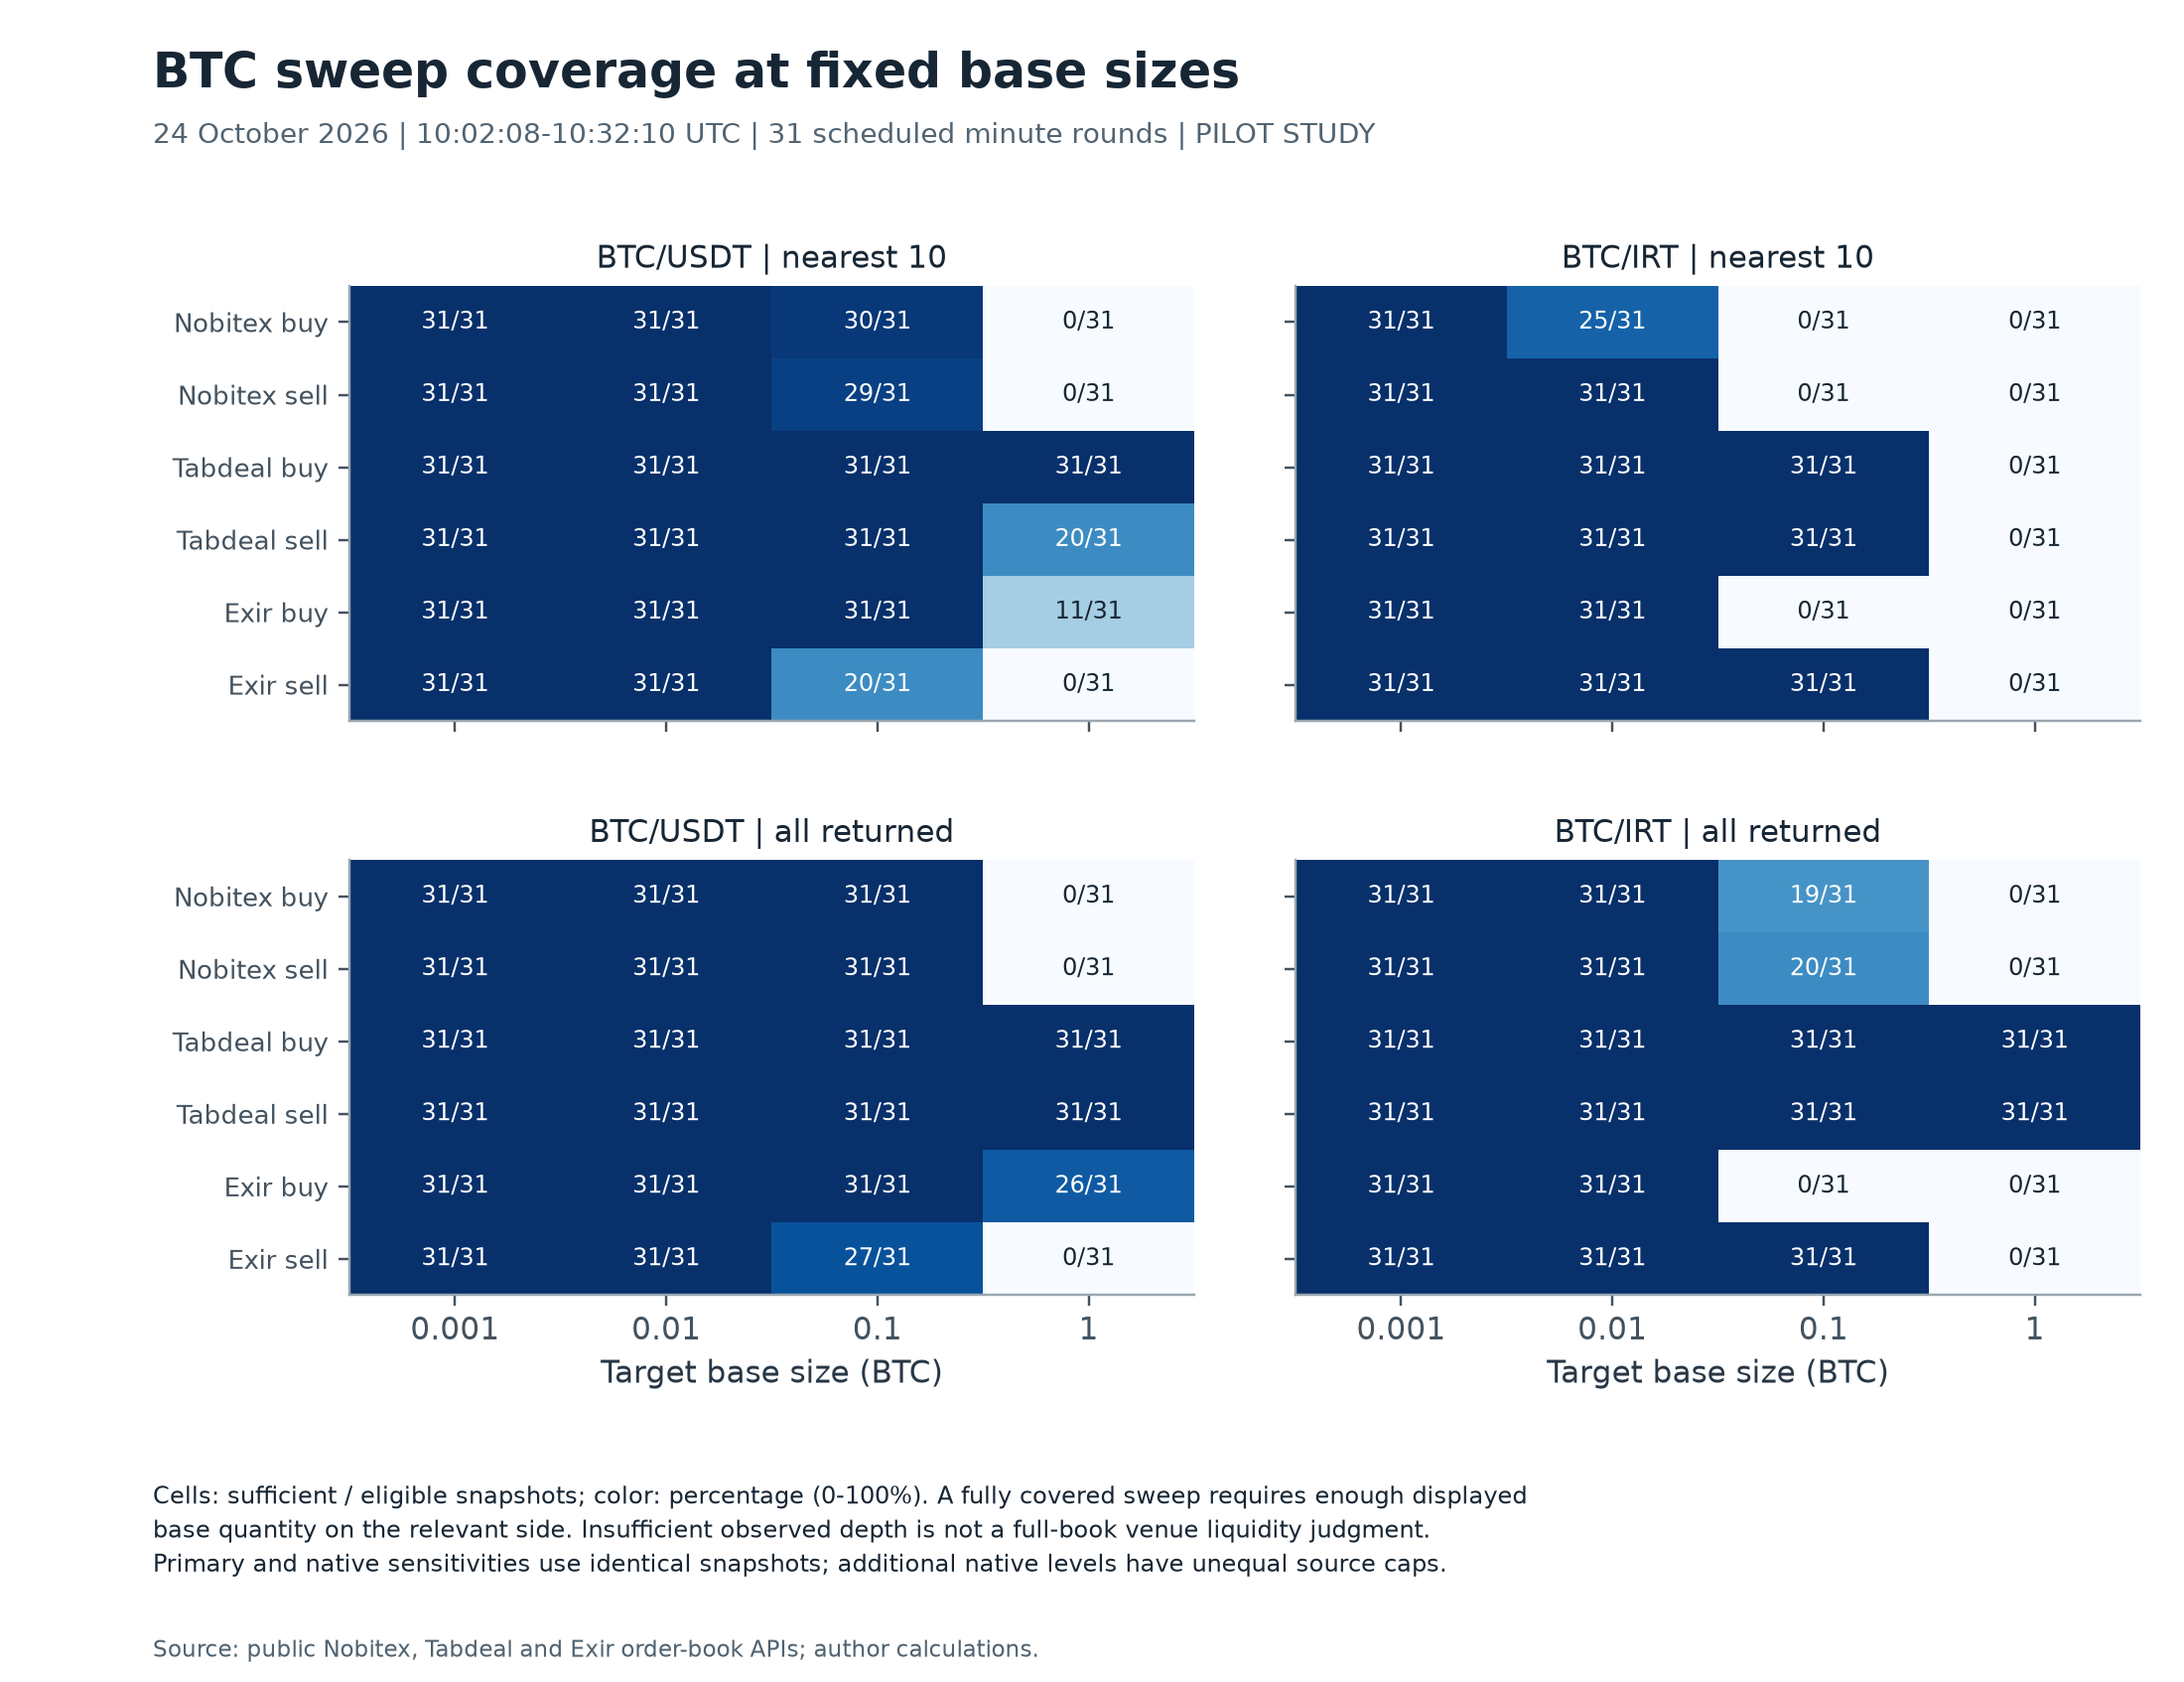
Full-order VWAP requires enough observed quantity. Inadequate visible depth remains an explicit insufficient-depth outcome rather than an extrapolated price.
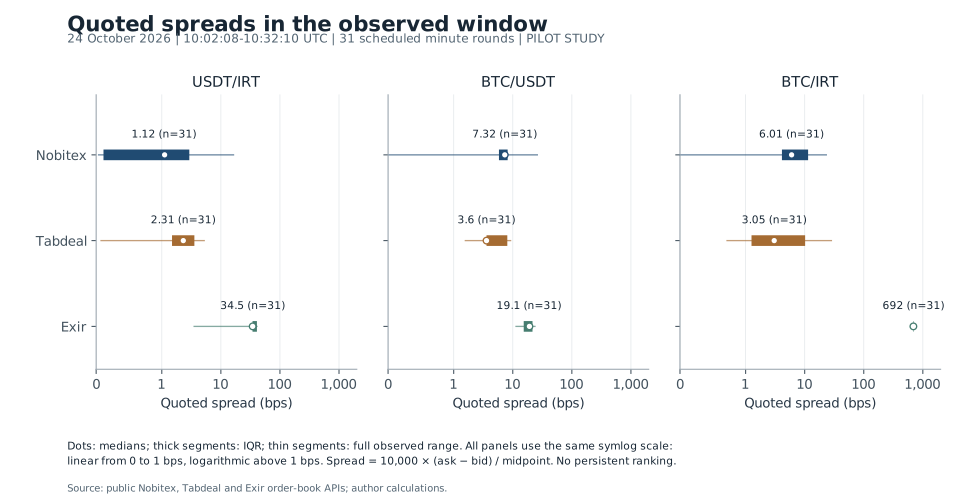
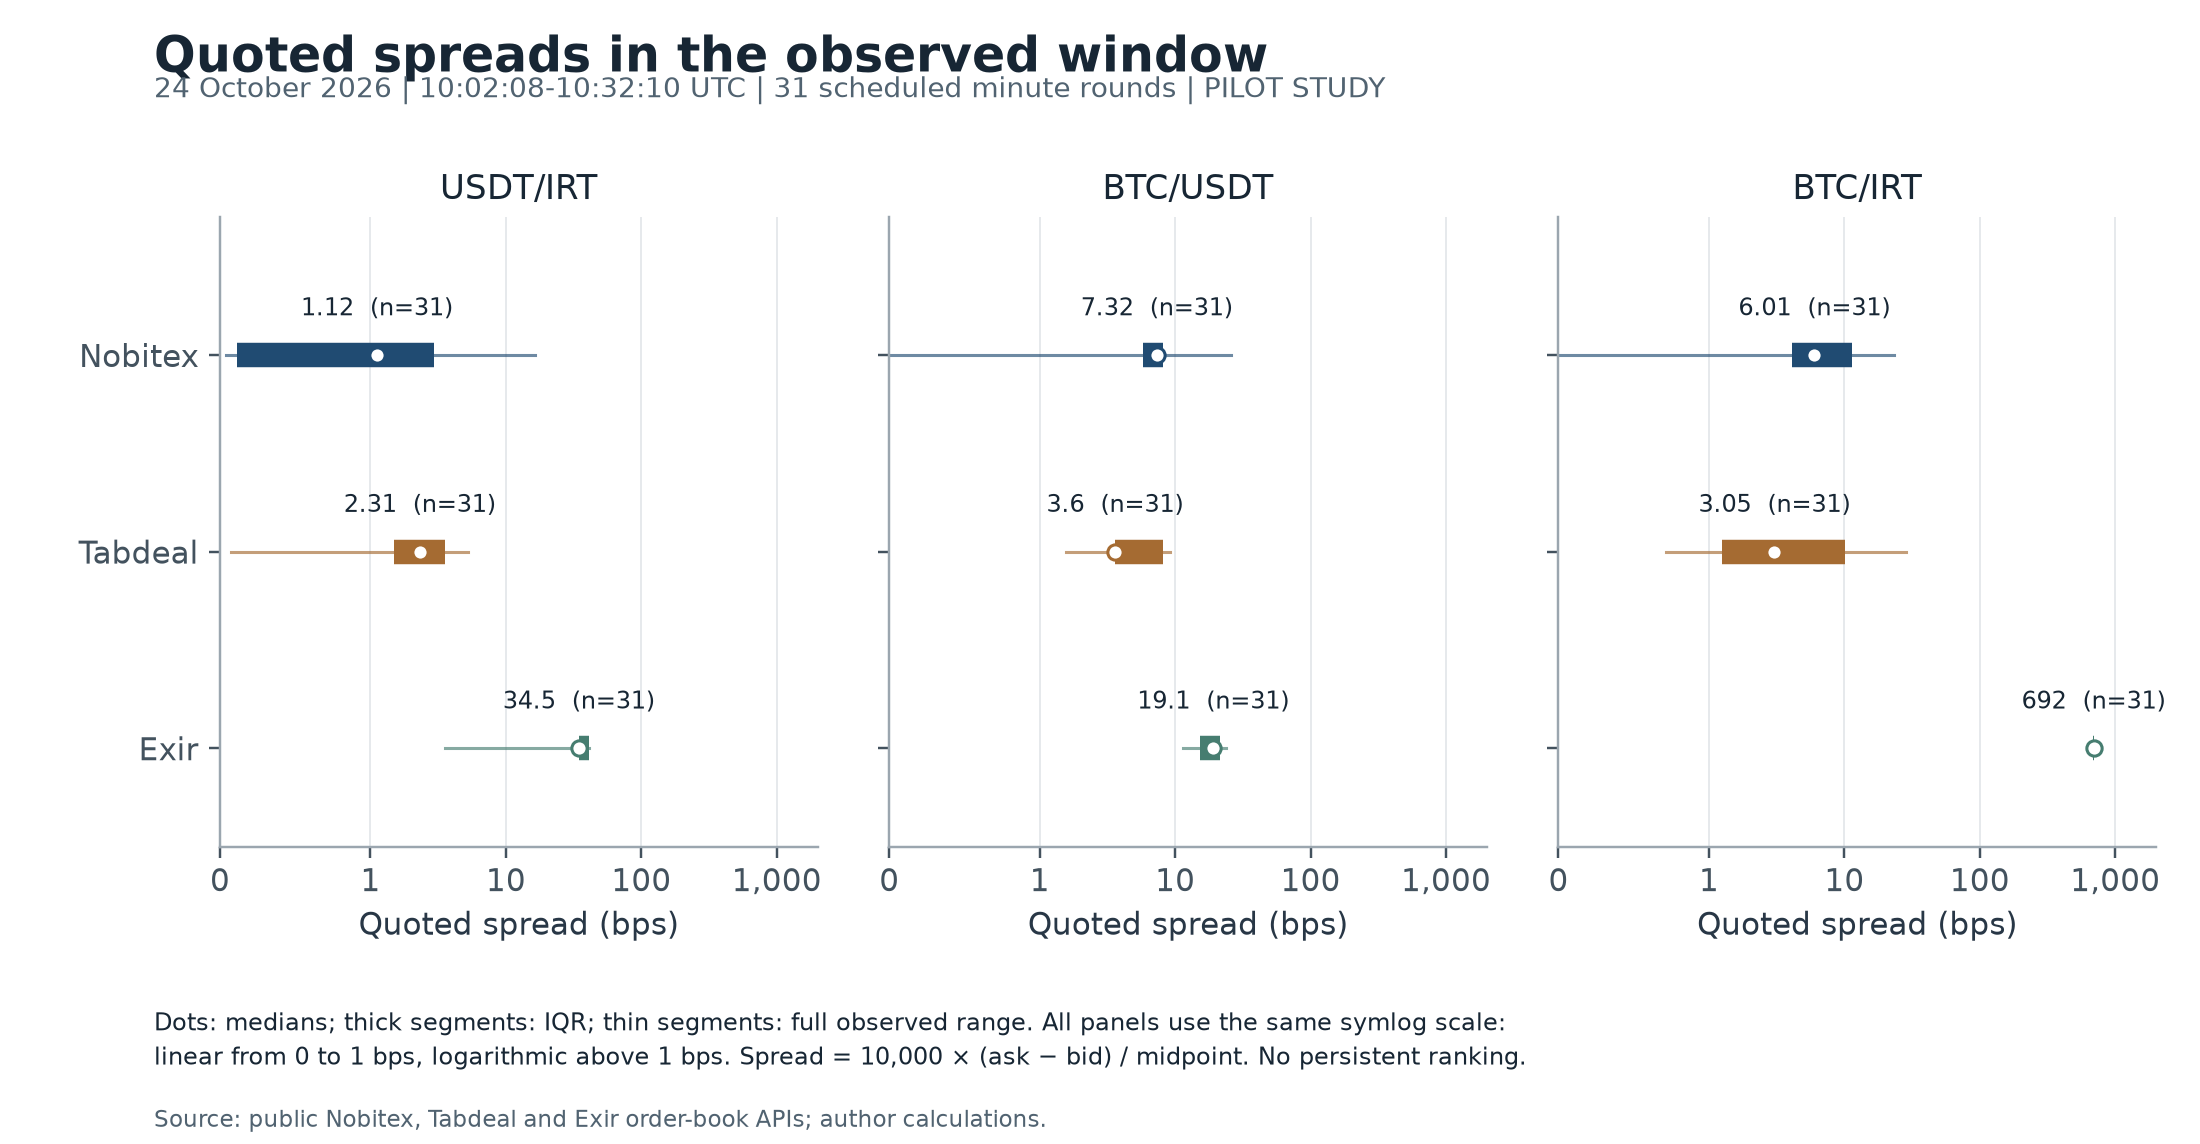
Quoted spreads are summarized below for all nine venue–pair groups. The primary view uses the nearest ten distinct levels on each side. Spread itself is determined by the best quotes; depth and sweep costs depend on the visible levels and requested size. A narrow spread therefore does not establish inexpensive execution for a larger order.
| Venue | Pair | Valid / records | Median bps | IQR bps | Range bps |
|---|---|---|---|---|---|
| Nobitex | USDT/IRT | 31/31 | 1.12 | 0.11–2.92 | 0.04–16.37 |
| Tabdeal | USDT/IRT | 31/31 | 2.31 | 1.49–3.56 | 0.07–5.22 |
| Exir | USDT/IRT | 31/31 | 34.55 | 34.36–40.77 | 3.53–40.77 |
| Nobitex | BTC/USDT | 31/31 | 7.32 | 5.84–8.19 | 0.00124–26.03 |
| Tabdeal | BTC/USDT | 31/31 | 3.60 | 3.60–8.08 | 1.57–9.18 |
| Exir | BTC/USDT | 31/31 | 19.13 | 15.32–21.57 | 11.35–23.74 |
| Nobitex | BTC/IRT | 31/31 | 6.01 | 4.12–11.42 | 4.63e-7–23.22 |
| Tabdeal | BTC/IRT | 31/31 | 3.05 | 1.26–10.17 | 0.72–28.31 |
| Exir | BTC/IRT | 31/31 | 691.89 | 683.84–696.55 | 676.88–719.90 |
Spread = 10,000 × (best ask − best bid) / midpoint. IQR is the 25th–75th percentile. These are descriptive sample distributions, not independent experiments or persistent venue rankings.
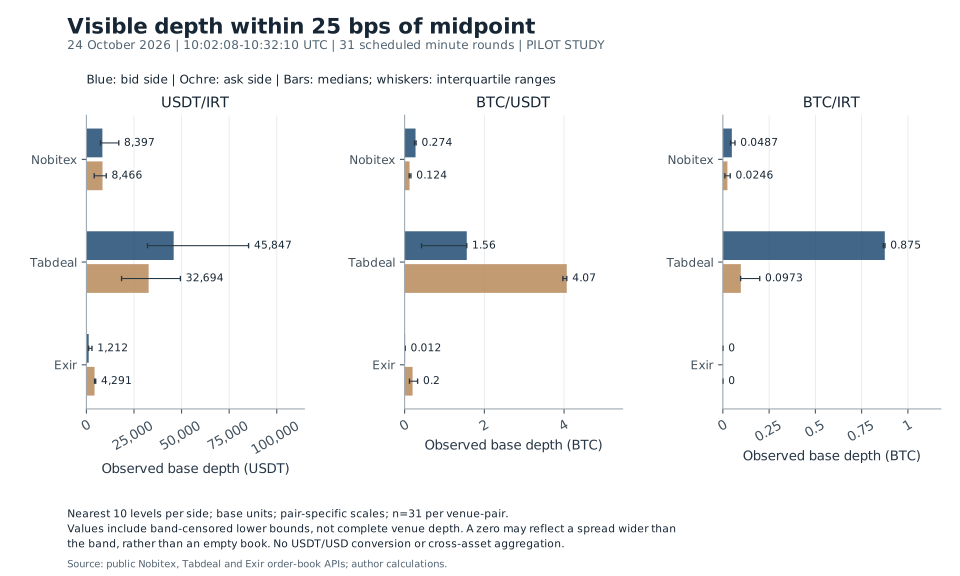
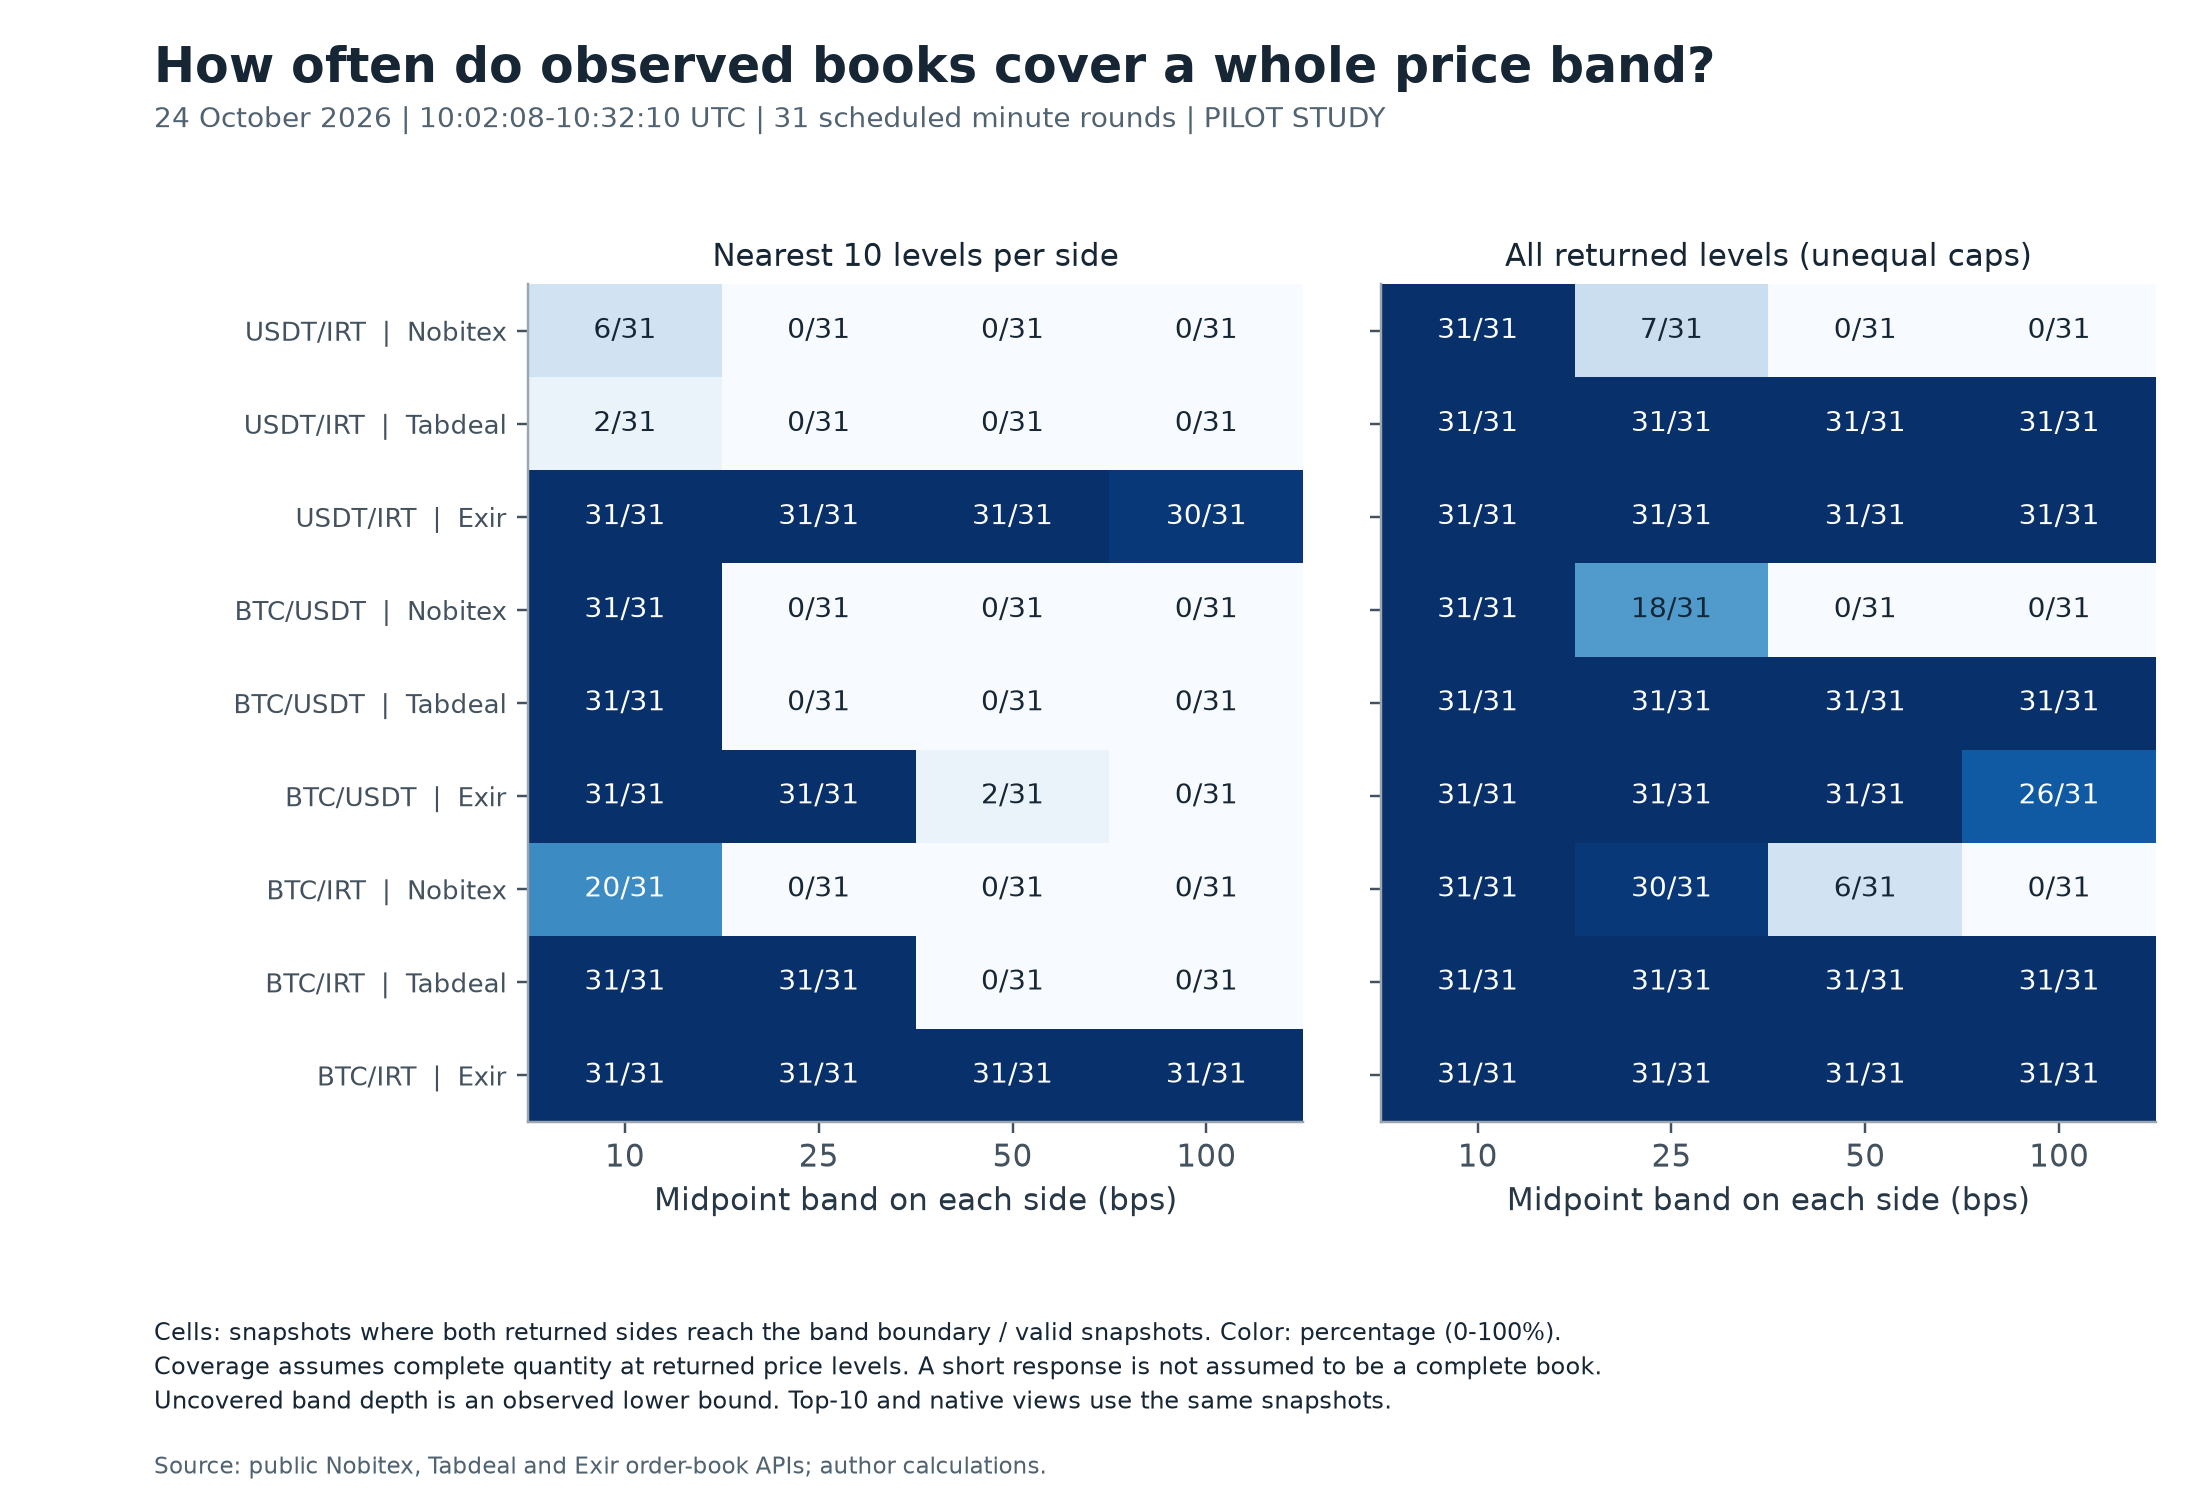
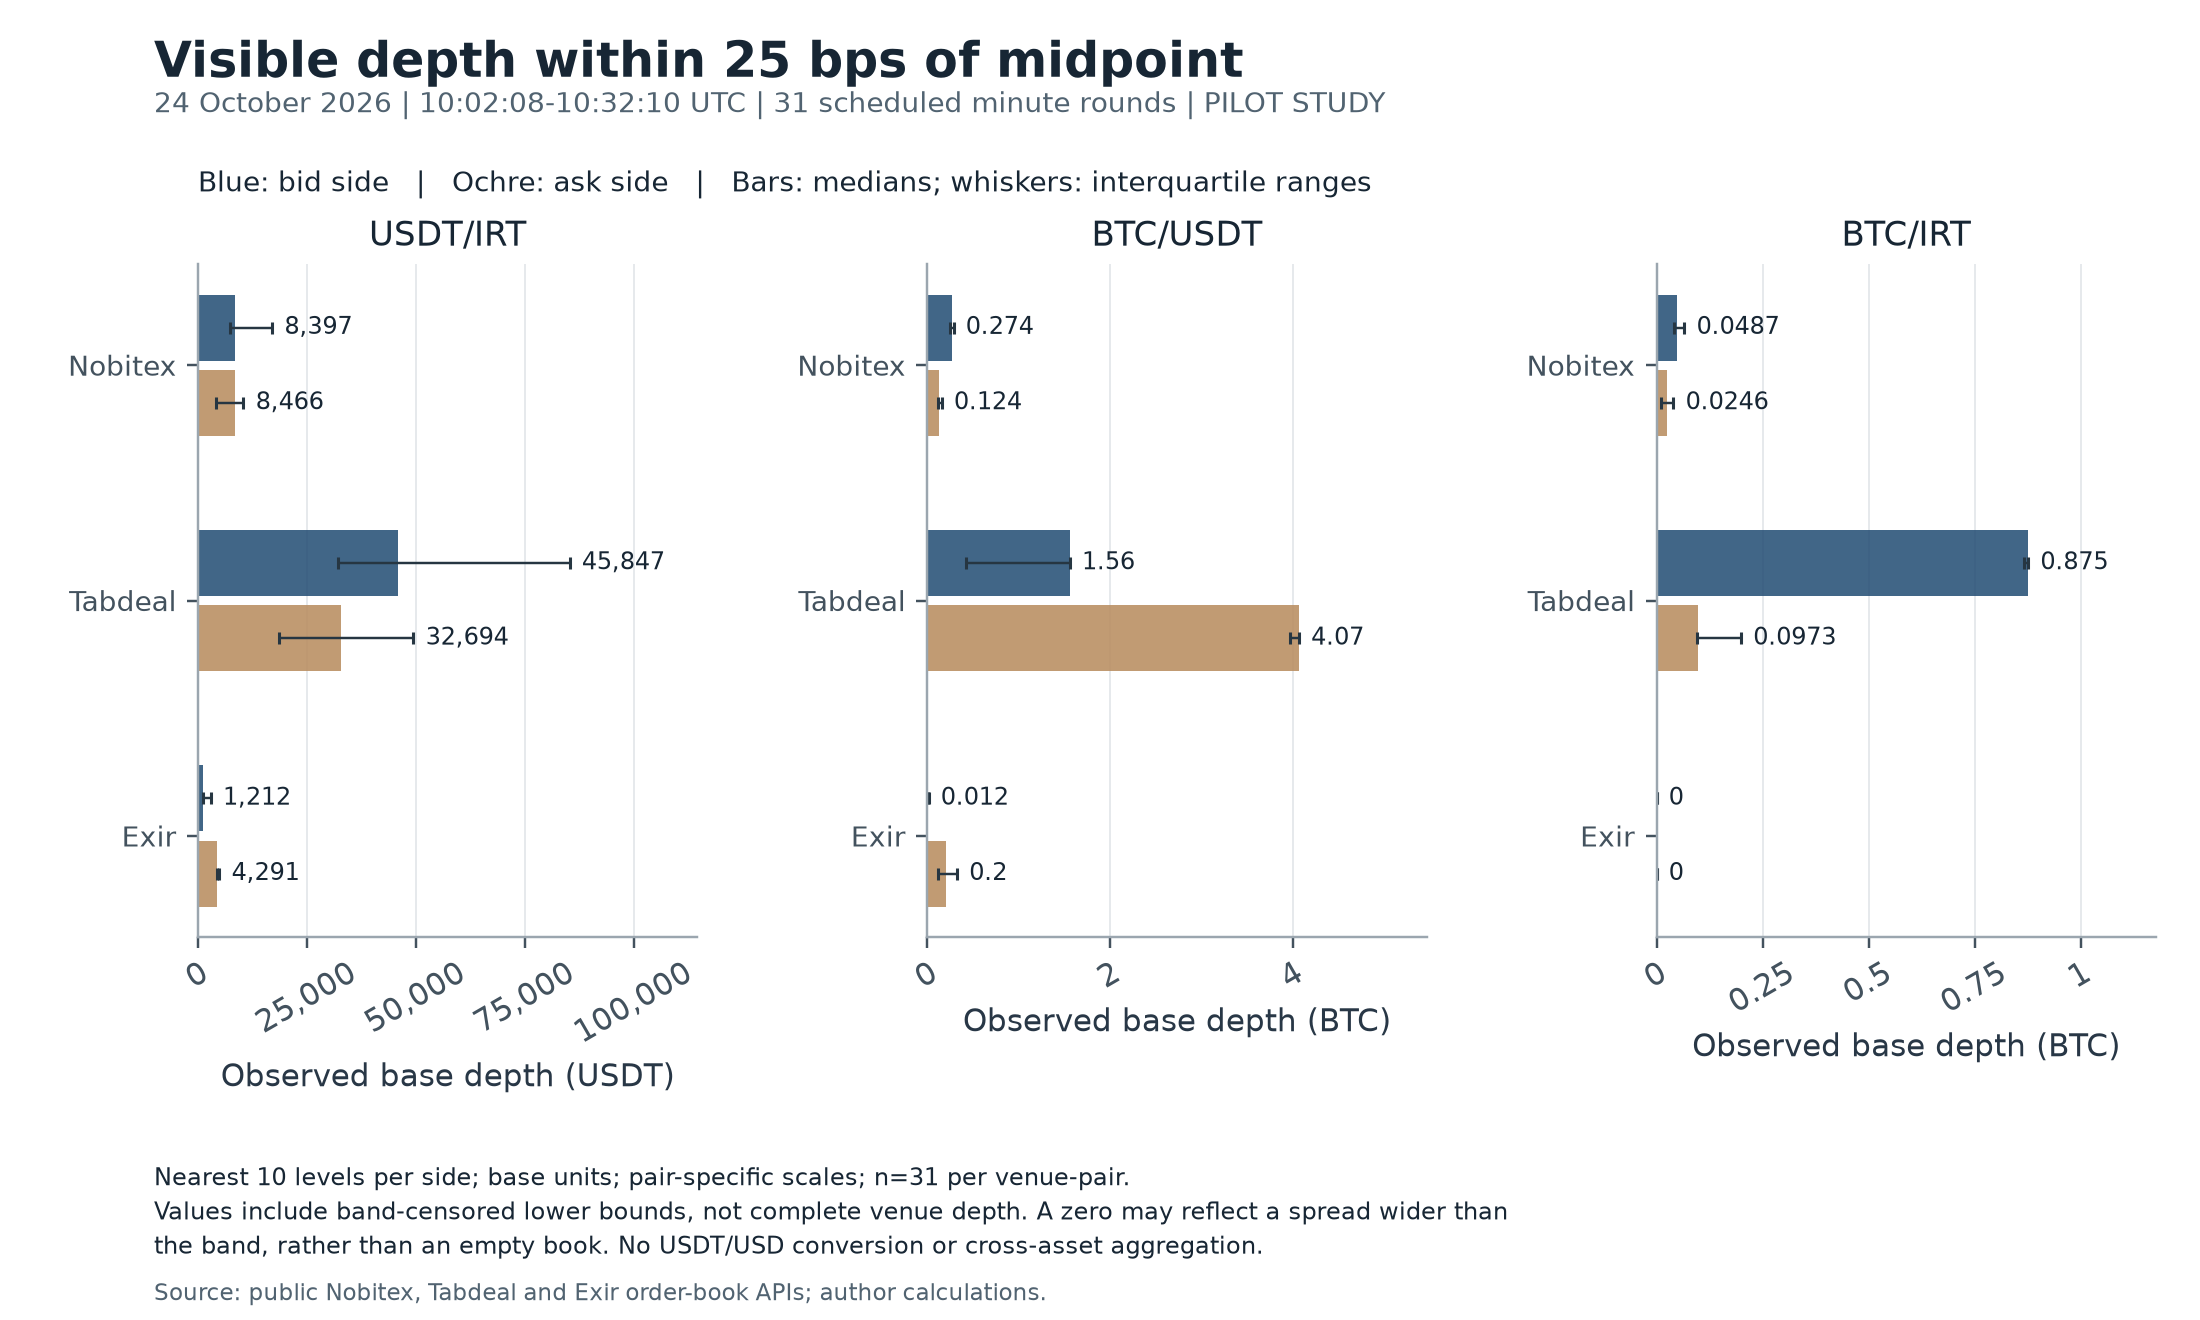
Depth within a price band answers a different question from the best quoted price. The study measures the base-asset quantity on each side within 10, 25, 50 and 100 basis points of midpoint. If the returned prices do not reach a band boundary, the observed quantity is a lower bound, not a complete estimate of that venue's depth.
A shared ten-level cap improves one aspect of comparability but does not make books equally complete or equally wide in price. The native-depth sensitivity retains every returned level while explicitly acknowledging unequal provider caps. Zero observed depth in a narrow midpoint band can also result from a spread wider than the band; it does not necessarily mean an empty book.
| Venue | Pair | Top 10 covered / valid | All returned covered / valid |
|---|---|---|---|
| Nobitex | USDT/IRT | 0/31 | 7/31 |
| Tabdeal | USDT/IRT | 0/31 | 31/31 |
| Exir | USDT/IRT | 31/31 | 31/31 |
| Nobitex | BTC/USDT | 0/31 | 18/31 |
| Tabdeal | BTC/USDT | 0/31 | 31/31 |
| Exir | BTC/USDT | 31/31 | 31/31 |
| Nobitex | BTC/IRT | 0/31 | 30/31 |
| Tabdeal | BTC/IRT | 31/31 | 31/31 |
| Exir | BTC/IRT | 31/31 | 31/31 |
Coverage assumes complete aggregated quantity at each returned price level. A short response is not automatically a full book. Bid–ask imbalance is calculated only when both band edges are covered and the denominator is positive; it is not a directional price forecast.
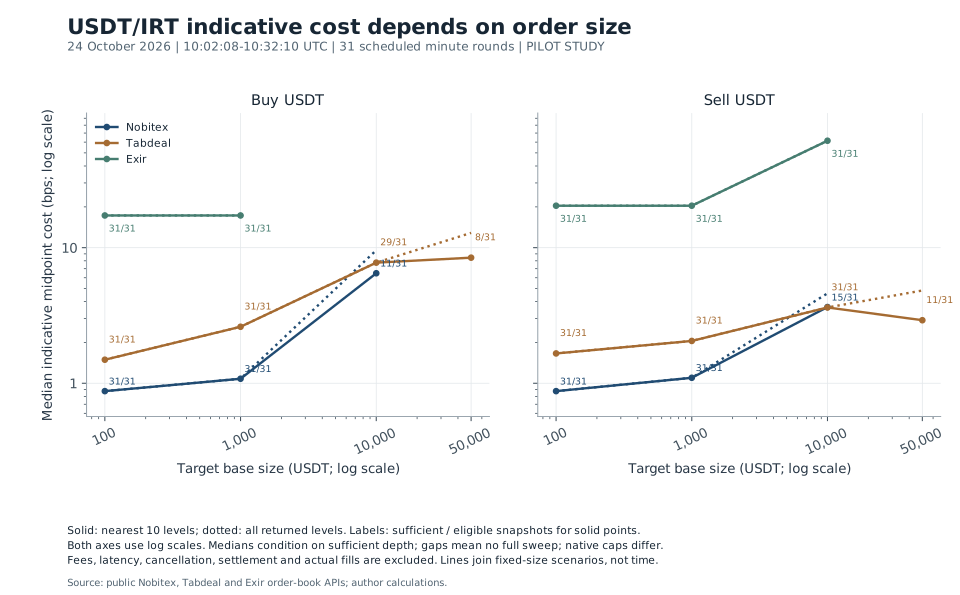
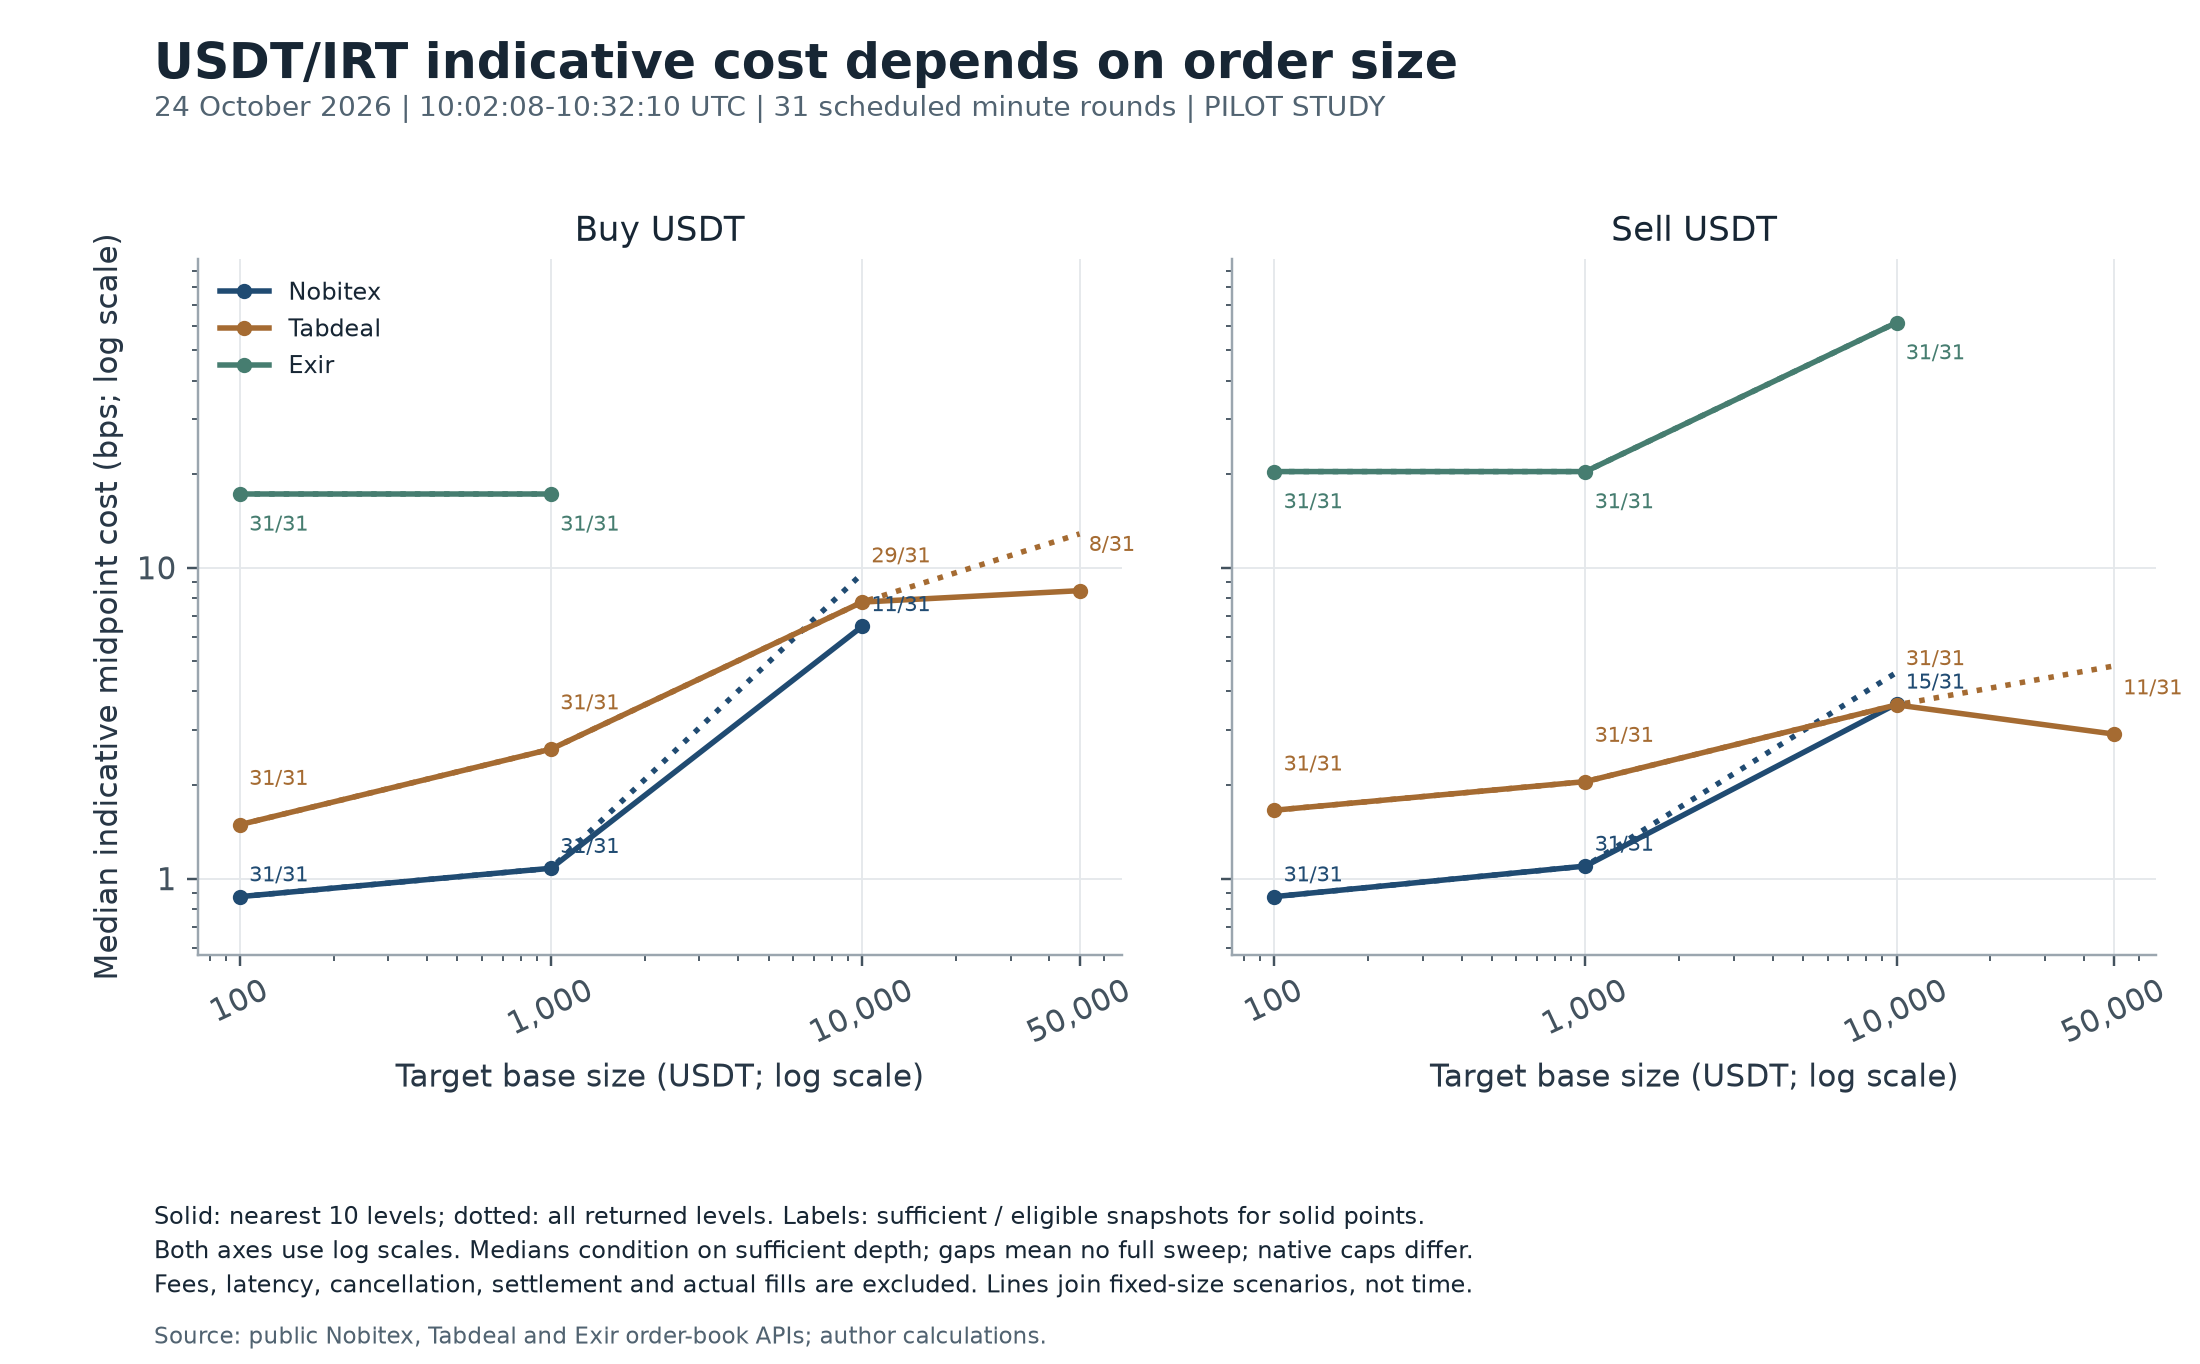
A hypothetical buy consumes asks from the cheapest price upward; a hypothetical sell consumes bids from the highest price downward. Each calculation permits a partial final level and conserves the fixed base quantity. Only fully covered targets receive a complete-order VWAP.
The table shows one pre-specified scenario: a 1,000-USDT target in USDT/IRT, using the primary nearest-ten-level view. Each cost median is conditional on sufficient observed depth; its sufficiency denominator is part of the result, not a footnote. The full report and exhibits also cover the other fixed USDT and BTC sizes.
| Venue | Direction | Sufficient / eligible | Median midpoint cost, bps |
|---|---|---|---|
| Nobitex | Buy | 31/31 | 1.08 |
| Nobitex | Sell | 31/31 | 1.10 |
| Tabdeal | Buy | 31/31 | 2.61 |
| Tabdeal | Sell | 31/31 | 2.05 |
| Exir | Buy | 31/31 | 17.27 |
| Exir | Sell | 31/31 | 20.39 |
Buy cost = 10,000 × (VWAP / midpoint − 1); sell cost = 10,000 × (1 − VWAP / midpoint). Costs include the spread component and walking the displayed book. A missing cost means no fully covered target in that subgroup. Fees, latency, cancellations, replenishment, transfers, funding, custody and actual fills are excluded.
These are static arithmetic counterfactuals, not realized implementation shortfall or causal price impact. Institutional work supports reporting size-aware costs and visible-depth sufficiency separately; transaction-based impact estimation requires evidence this pilot does not contain.2, 4
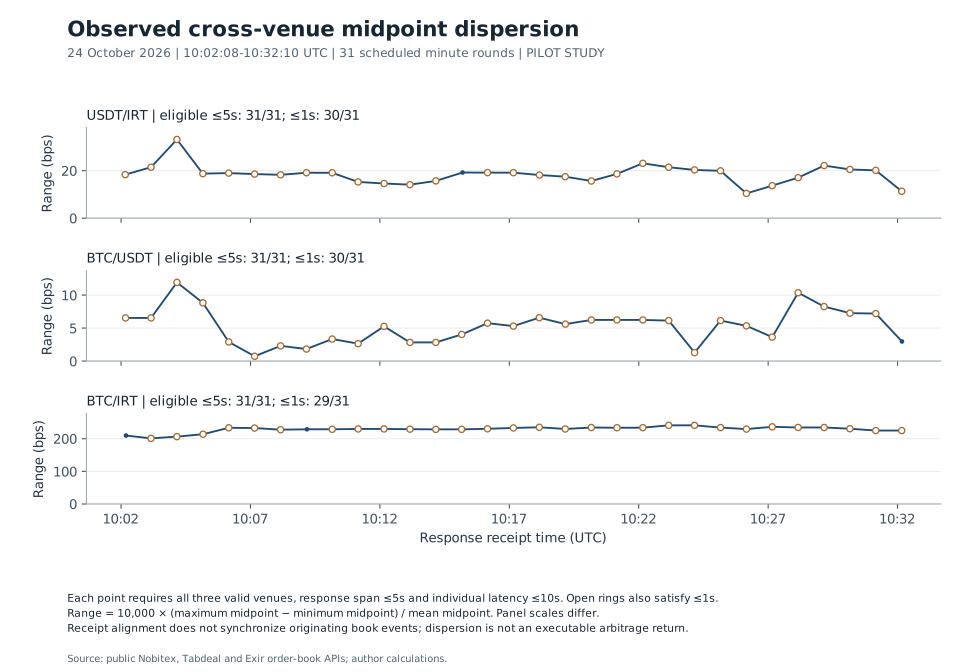
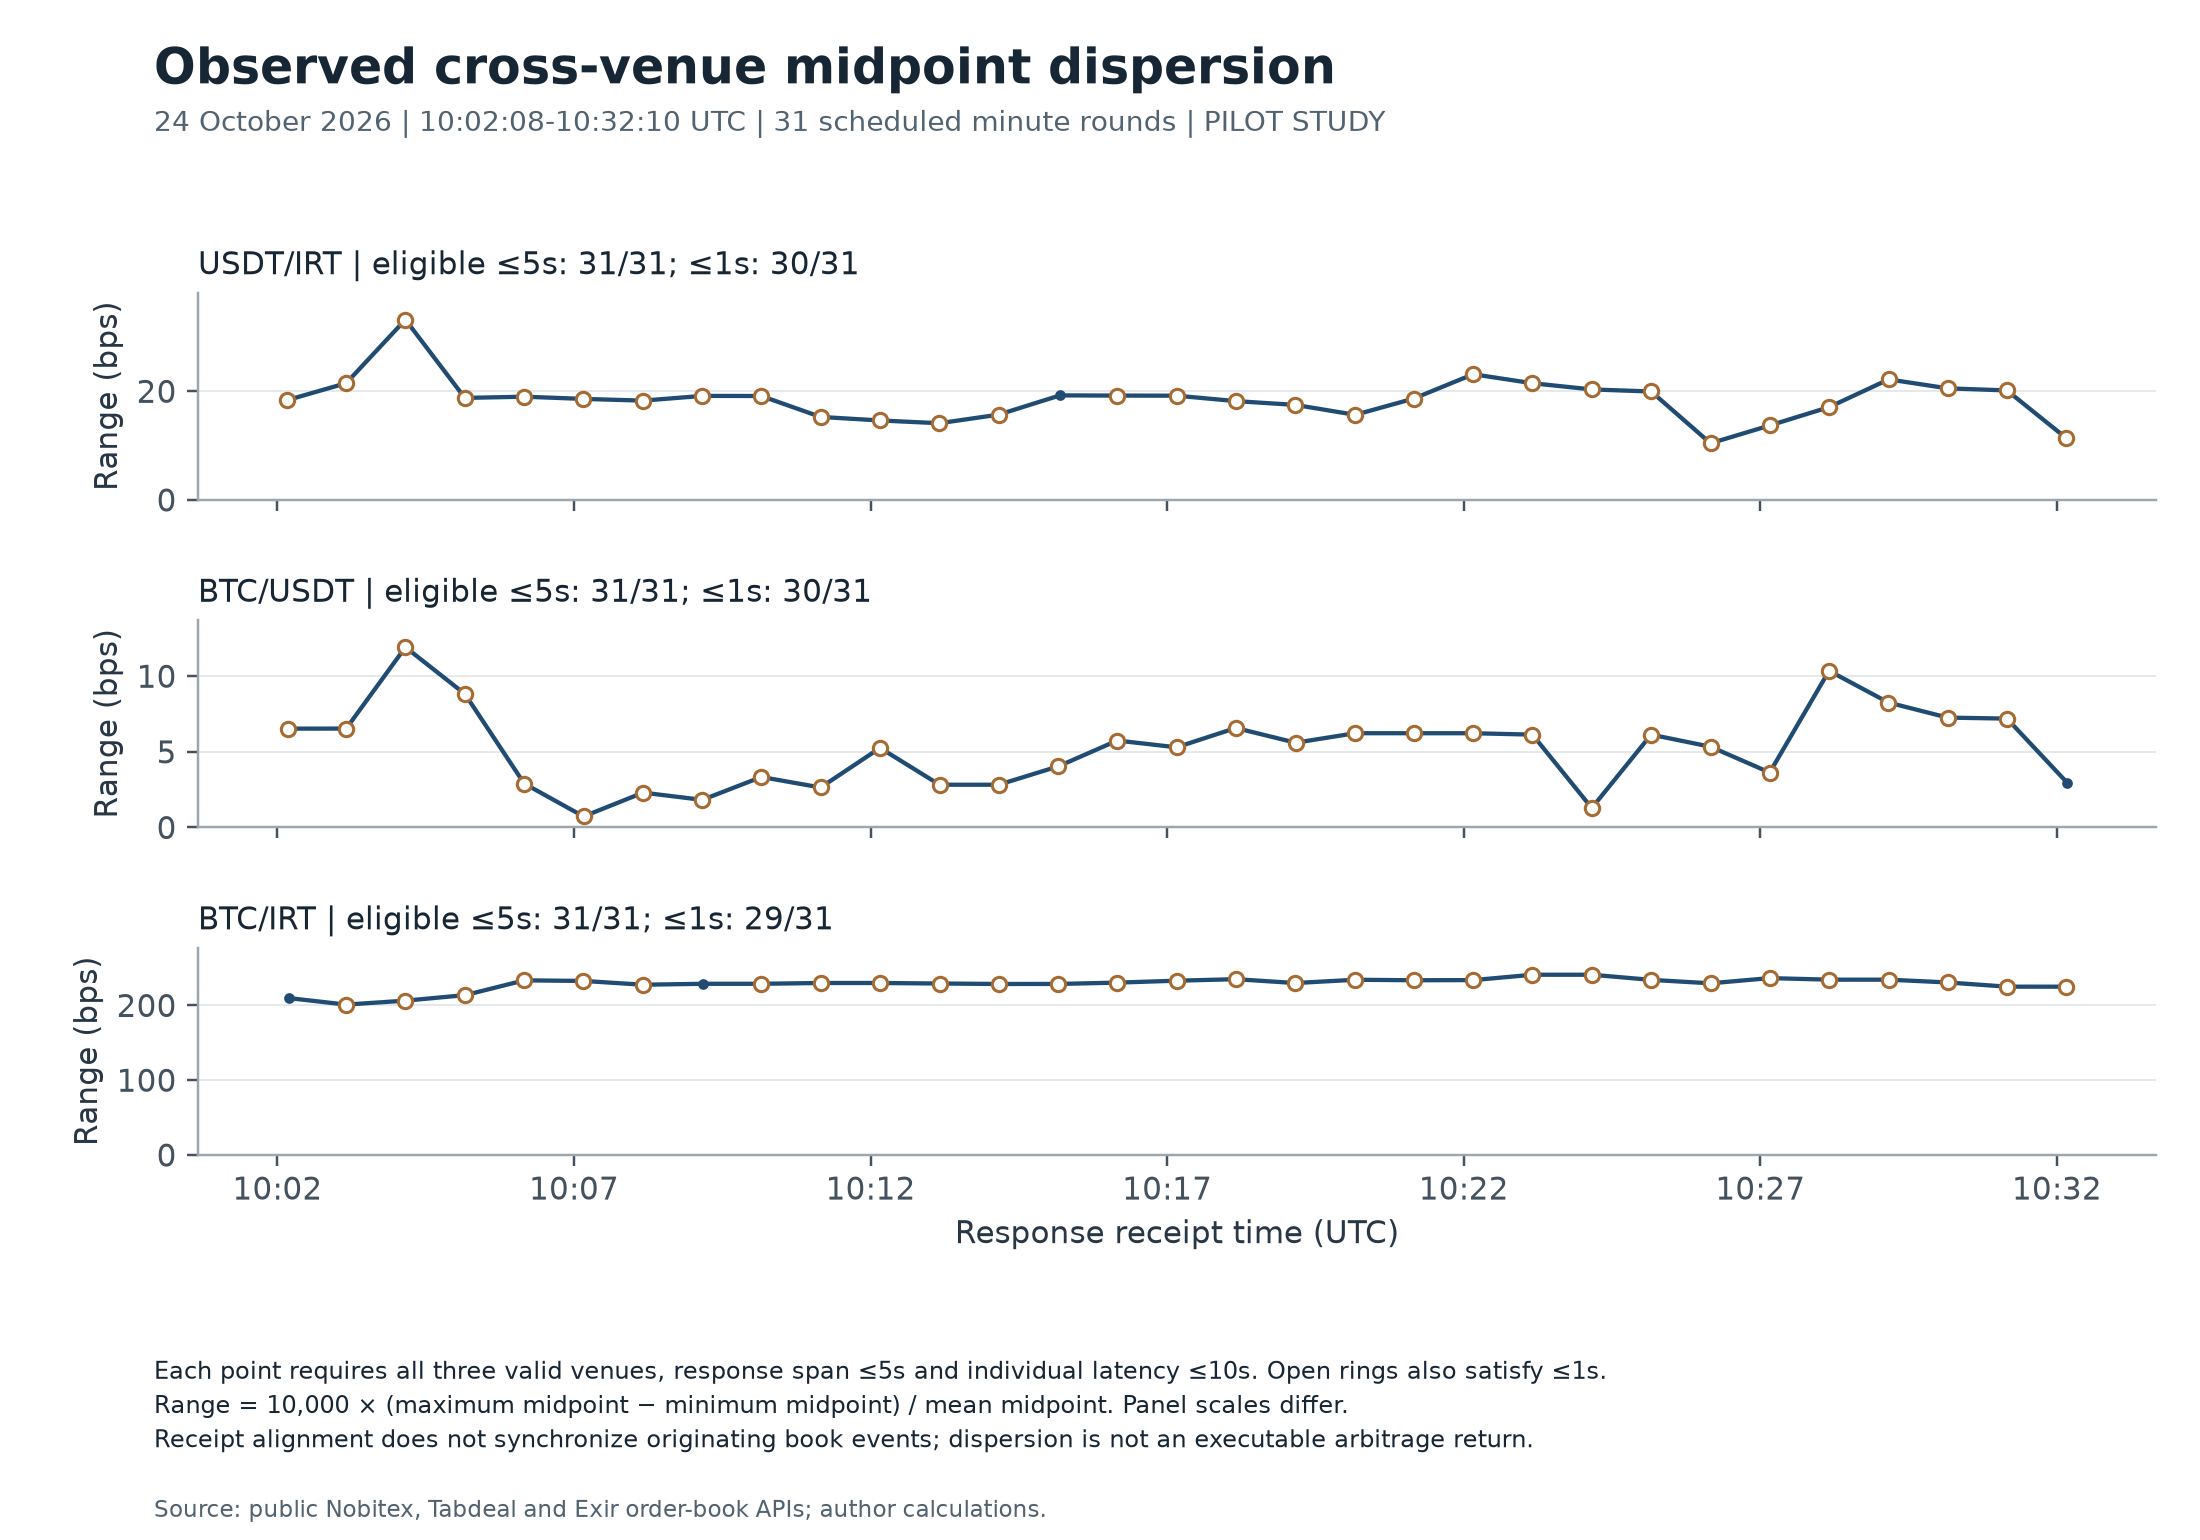
For same-pair comparisons, all three venue books must be valid in a round, each request latency must be no more than ten seconds, and the receive-time span must be no more than five seconds. A one-second receipt-span sensitivity is reported separately. Midpoint dispersion is 10,000 × (maximum midpoint − minimum midpoint) / mean midpoint.
| Pair | ≤5s / planned rounds | Median range, bps | ≤1s / planned rounds | Median range ≤1s, bps |
|---|---|---|---|---|
| USDT/IRT | 31/31 | 18.78 | 30/31 | 18.72 |
| BTC/USDT | 31/31 | 5.60 | 30/31 | 5.67 |
| BTC/IRT | 31/31 | 229.99 | 29/31 | 230.49 |
The denominator is the planned round count, explicitly including unmatched or unobserved rounds. Receipt alignment cannot certify originating-event simultaneity, particularly when source timestamps are missing or their meaning is unverified.
Quote dispersion is evidence of observed disagreement within an eligible sample, not a net arbitrage return. Historical research motivates attention to segmentation and limits to arbitrage; it does not identify their cause here. Nor can displayed quantities simply be summed into guaranteed consolidated executable depth.5, 6
The timestamped local protocol was frozen before the main collection cohort. It is a local pre-analysis plan, not a public preregistration. Source-discovery requests and the earlier two-source preflight are excluded. Requests use unauthenticated, read-only public endpoints; no trades, accounts, private employer systems or access-control workarounds are involved.
Source quality is part of the measurement, not a side issue. Tabdeal supplies no book event timestamp in the reviewed depth response. Nobitex's timestamp is interpreted operationally as Unix milliseconds, but its book-field semantics are not explicitly documented. Exir supplies an ISO timestamp whose generation/update meaning is also unverified. Timestamp age is therefore metadata age, not proven book staleness.
| Venue | Pair | Median latency, ms | Median bid levels | Median ask levels | Book event-time status |
|---|---|---|---|---|---|
| Nobitex | USDT/IRT | 139.8 | 24.0 | 24.0 | Unverified semantics |
| Tabdeal | USDT/IRT | 297.0 | 100.0 | 96.0 | Not supplied |
| Exir | USDT/IRT | 543.2 | 20.0 | 7.0 | Unverified semantics |
| Nobitex | BTC/USDT | 154.8 | 24.0 | 24.0 | Unverified semantics |
| Tabdeal | BTC/USDT | 306.3 | 100.0 | 100.0 | Not supplied |
| Exir | BTC/USDT | 527.0 | 20.0 | 20.0 | Unverified semantics |
| Nobitex | BTC/IRT | 154.4 | 24.0 | 24.0 | Unverified semantics |
| Tabdeal | BTC/IRT | 376.3 | 100.0 | 100.0 | Not supplied |
| Exir | BTC/IRT | 524.0 | 19.0 | 5.0 | Unverified semantics |
Network latency is not quote age. Repeated payloads do not prove an outage, and HTTP Date is not a book event timestamp. Actual returned levels, rather than an assumed provider maximum, determine observed depth.
Wallex and Bitpin were excluded from repeated collection under a conservative robots/access-policy decision despite documented public API functionality. Their omission is not a finding about their liquidity or reliability. The three included sources are a convenience-selected sample, not a representative universe.
The practical implication is a measurement discipline: evaluate spread, size, coverage, timing and access separately before drawing an execution conclusion. The next full edition requires a longer, documented sampling window, broader eligible coverage, stronger event-time evidence where available and a cleared publication scope—not stronger wording around this pilot.
Seyed Iman Hosseini is Market Making & Dealing Desk Lead at Blu Caps and formerly worked at Wallex. These professional relationships are disclosed as relevant context. The study is prepared in a personal, independent capacity using public, unauthenticated market data. No confidential employer, customer, account or execution data are used. Employer sponsorship, approval and endorsement are not asserted.
Research, coding, analysis, editorial production and validation used AI assistance. Computational and editorial checks are part of the same assisted workflow and are not external academic or human peer review.
Publication and data scope. This page presents original analysis, aggregate tables and six statistical figures, including a receipt-aligned derived time series. Raw API responses, normalized order-book level arrays and observation-level datasets remain in the private evidence archive. No blanket open-data or Creative Commons license for provider data is asserted. No account, private order or customer information is published.
Source attribution does not imply venue approval, sponsorship or endorsement. The report is not a venue data feed, an investment recommendation or a guarantee of execution. Future sampling would be a separate study; no ongoing market collector has been established.
These sources inform measurement and interpretation. Their historical datasets and market-specific empirical findings are not presented as evidence about this pilot.